Market Share and Brand Position Metrics
We present market share and brand position metrics in the Stats dashboard. With this number, you can see the position of the keywords you use in your target market among other competitors. You can then do further research to optimize your market opportunities and potential.
Market Share shows the level of market share in your domain compared to competitors in the same market. You succeed in dominating the market if the market share value of your brand is higher than competitors. These values will also affect the position of your brand.
Brand Position describes the position of the brand compared to competitors in the same target market. A high percentage of market share will cause your brand a high position as well. Your brand will be the market leader if it is in the highest position.
In this metric, we will display the market share value and brand position of the search results competitors and direct competitors. We take the information up to the top 100 SERP page positions for each keyword, then determine the CTR and market share for rankings 1-20.
Please note that search results competitors are competitors who appear in organic search results for the domain you are targeting, the domain is generated directly by the system. Meanwhile, direct competitors are other business domains that you set on your watchlist.
How to Calculate Market Share and Brand Position
To determine the percentage of market share, you need to calculate SOV (Share of Voice). The SOV value represents the estimated visibility and dominance of your brand compared to competitors, obtained by multiplying the Click-Through Rate (CTR) and Search Volume for each keyword in your domain.
After knowing the SOV value, you can determine the total market share of your brand by adding up the SOV of all the keywords in your domain. In order to determine the total market share, add up your brand's SOV with the SOV of all your competitors.
Next, the market share percentage is obtained from the division between your brand's total market share and the total market share, then multiplied by 100. If you get a market share percentage of 58.40%, all of your competitors will take the market share of 41.60% for the same keywords. .
The percentage value of the market share determines the position of your brand compared to competitors in the same market. The higher the percentage value of your domain's market share, the higher your brand's position in that market.
Take a look at the following example, and enter the keywords "X" and "Y" which have a search volume of 10K and 100K, here's an example of calculating the leader on the SERP page.
| Keyword | Search Volume | Domain | Absolute rank | CTR | SoV |
|---|---|---|---|---|---|
| X | 10,000 | abexyz | 1 | 33.77% | 3,377 |
| X | 10,000 | defxyz | 2 | 12.94% | 1,294 |
| X | 10,000 | your domain | 3 | 6.94% | 694 |
| Y | 100,000 | your domain | 1 | 33.77% | 33,770 |
| Y | 100,000 | abexyz | 2 | 12.94% | 12,940 |
| Y | 100,000 | ghixyz | 3 | 6.94% | 6,940 |
| Domain | Total Market Share | Market Share Percentage |
|---|---|---|
| Your domain | 34,464 | 58.40% |
| abe.xyz | 16317 | 27.65% |
| def.xyz | 1,294 | 2.19% |
| ghixyz | 6940 | 11.76% |
| TOTAL | 59,015 | 100.00% |
Table 1 - Example of Market Share Calculation
Market Share and Brand Position Report
Market share and brand position reports are presented in different graphs. In this guideline, we will explain in detail the graphs that will be displayed in each metric, both market share and brand position.
Market Share Chart
Market share is presented in the form of a compound line graph that shows the difference in your domain's market share compared to competitors. Users can display data for the last few months (1 month, 3 months, 6 months, 12 months), data from the beginning of the year to the present, as well as the entire tracked market share data.
Hover your mouse over one of the coordinates in the chart to view the market share details. Sequence will display the percentage of your market share and your competitors and their increase/decrease compared to the previous day.
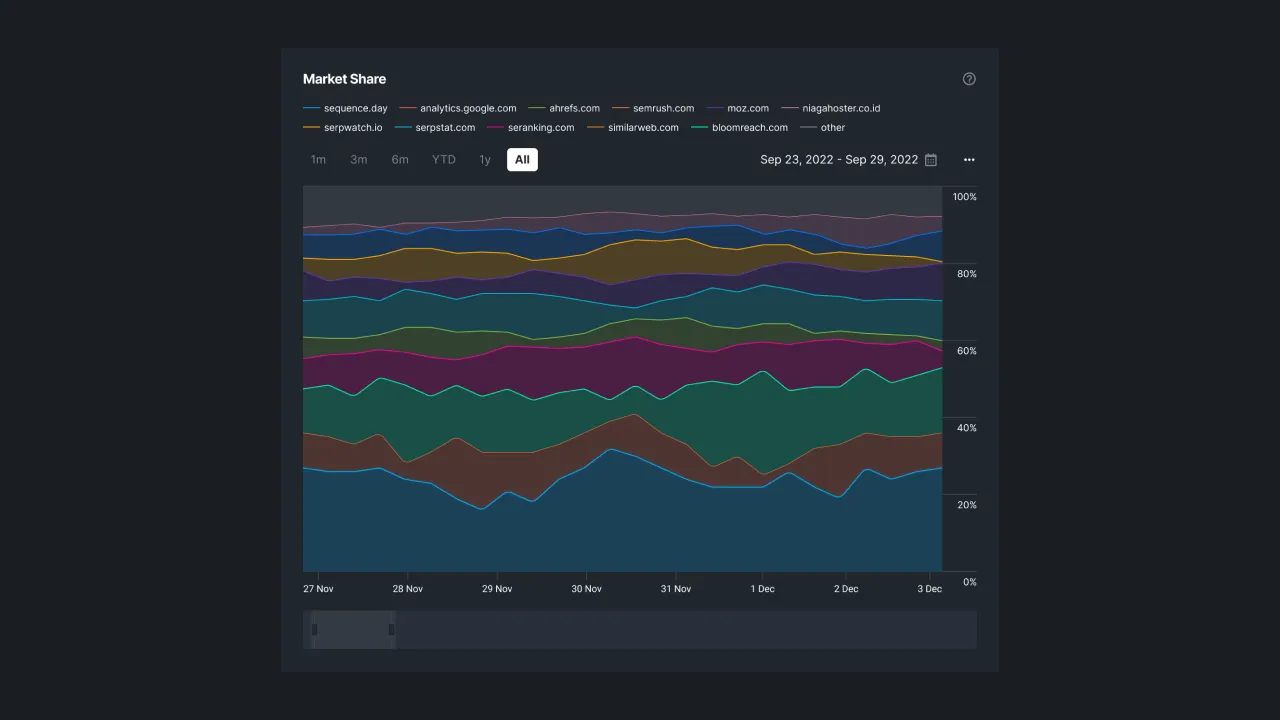 |
|---|
| Figure 1 - Market Share Multiple Line Chart |
Brand Position Chart
The brand position is depicted in a line graph that shows the position of your brand compared to competitors. We provide the option to display data from search results competitors as well as direct competitors that you have previously set.
Sequence allows you to display data at a specific time period according to the date you set. In addition, there is an option to display daily, weekly, and monthly brand position data by selecting a filter in the dropdown.
You can set the annotation at a specific position to add a note by pressing the Add Annotation Option. Next, the system will ask you to select an annotation type by pressing one of the options in the dropdown. After selecting the annotation, press the “Add Annotation” button to save the data.
The annotations that have been added will be displayed in the graph. Users can choose to show or hide annotations. By pressing one of the domains, the system will display the brand position of that domain and hide the position of other brands.
To delete an annotation in a graph, simply tap on the annotation to be deleted. Next, the system will display a data delete confirmation message. Press the "Delete" button to continue the process of deleting data or press "Cancel" to postpone.
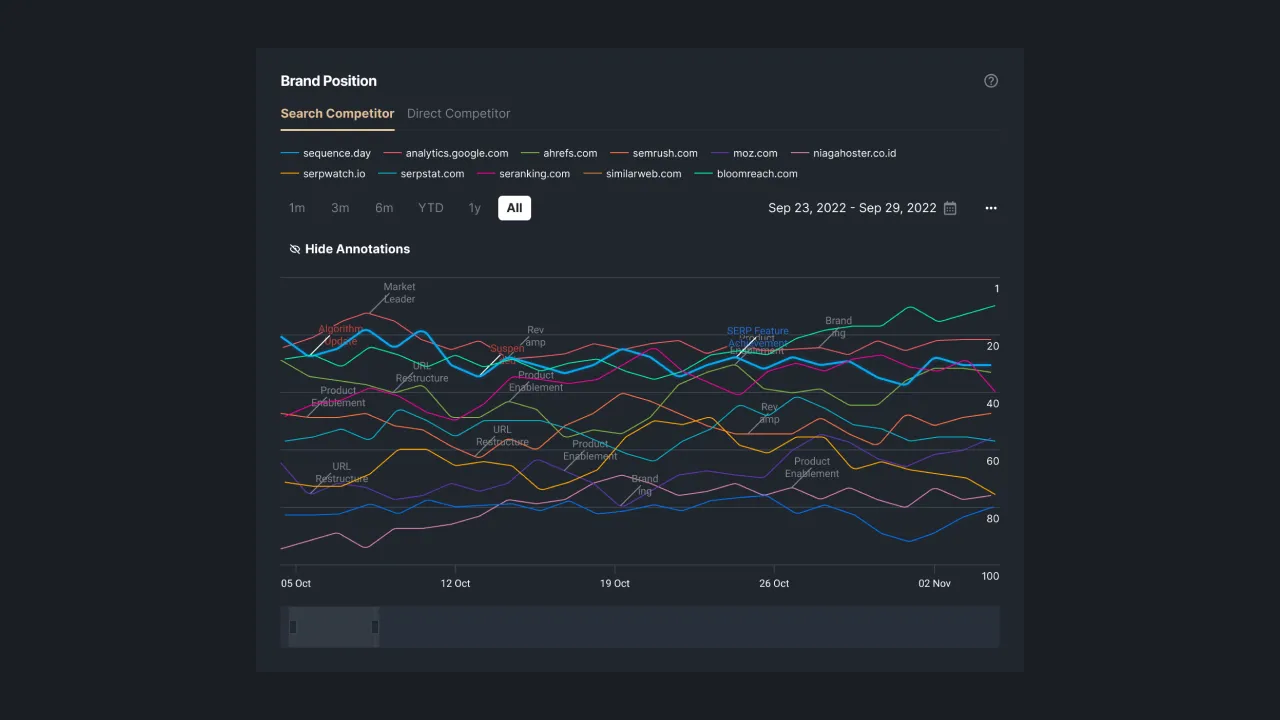 |
|---|
| Figure 2 - Brand Position Compound Line Chart |
So, that is the explanation of market share and brand position metrics in Sequence. If you need help understanding your market share or brand position and would like to increase your SEO visibility, feel free to contact our team via support@sequence.day.